SNGNN - Social Navigation Graph Neural Network
SNGNN
SNGNN is a Graph Neural Network to model adherence to social-navigation conventions for robots. Given a particular scenario composed of a room with any number of walls, objects and people (who can be interacting with each other) the network provides a social adherence ratio from 0 to 1. This information can be used to plan paths for human-aware navigation.GitHub repository.
TL;DR
The videos are at the bottom.Motivation:
As most researchers working on human-aware navigation, we used to handcraft the proxemics models our robots used for navigation.
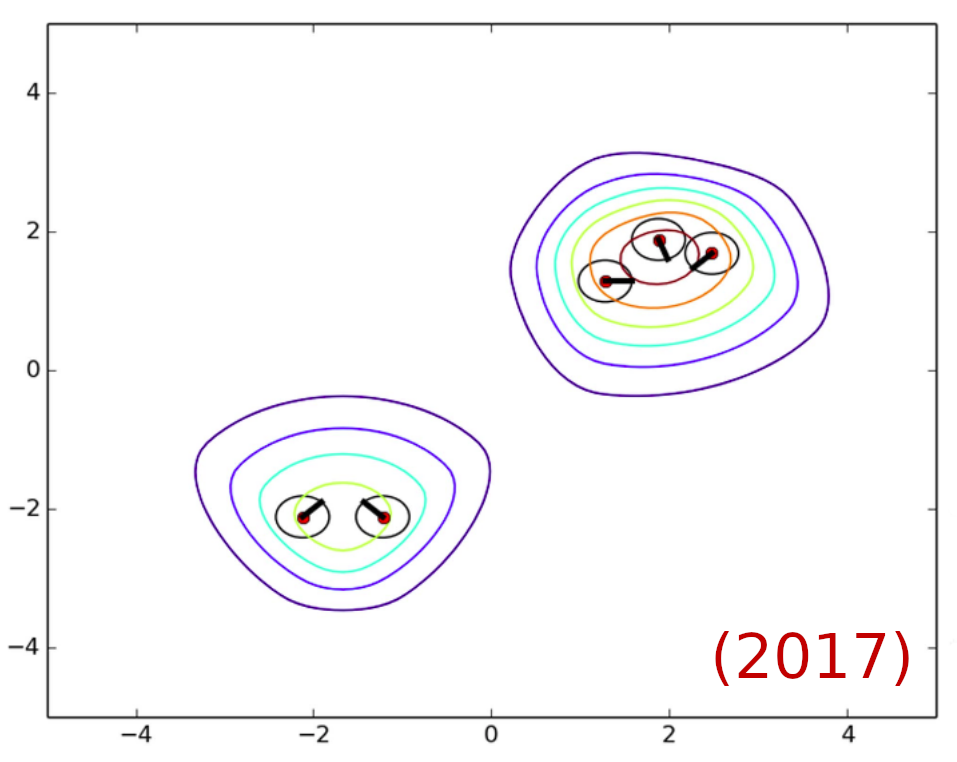
For instance, in our paper "Socially Acceptable Robot Navigation over Groups of People" (link) we used Gaussian Mixture Models to generate estimations of how irritating the presence of robots is in the different locations of any given environment (see Fig. 1).

It worked quite well, but it had limitations regarding scalability with respect to the number of factors to consider. The models becoming slower was not the biggest of our problems. The complexity of the code, the number of bugs to deal with and the time necessary to develop these new features made the process hard and expensive. At some point we realised that following a (hybrid) data-driven approach would probably be a good idea, especially more cost-efficient than hand-engineering the models. Additionally, it would allow us to investigate into aspects which we did not consider because we were aware of their importance.
Which data are we talking about
To choose the best ML model we have first to consider the nature of the data. Which are the main characteristics of the data usually considered in human-aware navigation?
- Heterogeneous: many factors
- Variable number of people
- Variable environment (variable shaped and sized)
- Variable number of objects
- Variable number of interactions
- Variable number of types of interactions
- Indeterminately complex & structured relationships
Considering all this variability in the input data, and especially its size and highly structured nature, it would be quite difficult to handcraft good descriptors for the scenarios that could be used for regular fully-connected NNs. Convolutional Neural Networks or conventional Recurrent Networks did not seem to be a good match for the data either. Therefore we decided to use Graph Neural Networks (GNNs, reference).
Using GNNs for human-aware navigation allows us to improve accuracy of other ML algorithms (see references at the bottom) and improve scalability (how can we increase the number of variables to consider?) for different tasks. Some of these tasks are:
- Model proxemics / inconvenience
- Predict people's movements
- Control robot's movements
- Detect & predict behaviours/events
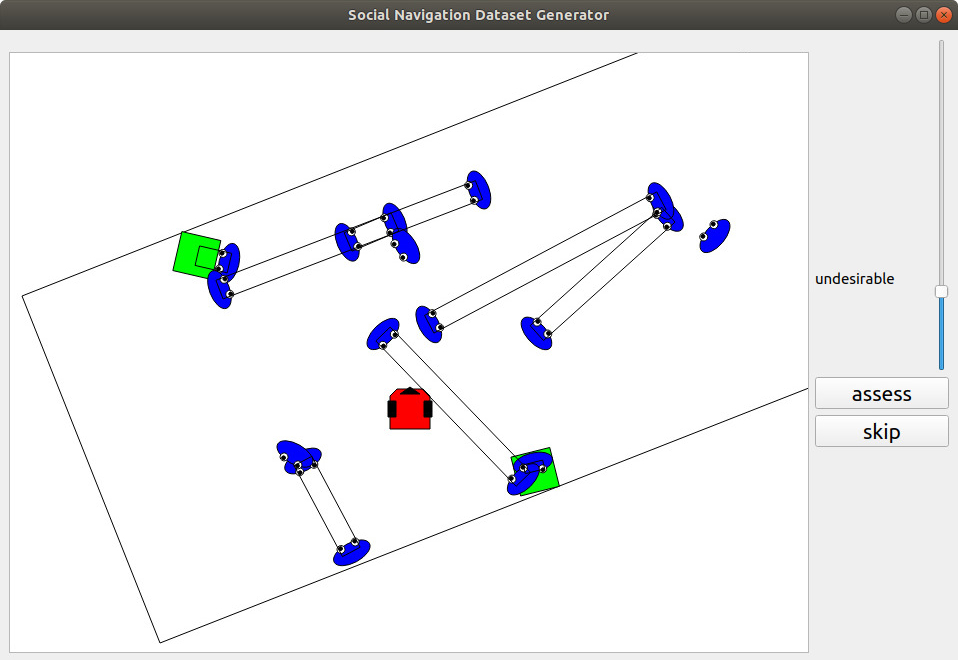
We were able to obtain labels from 0 to 100 for 9280 randomly generated scenarios comprising scenarios with varying data as described in the previous paragraphs. The tool used to generate the data is shown in Fig. 2. Even though the results we obtained are good, we are aware of some limitations that will be addressed in future datasets: a) humans are static, b) there is only one type of interaction, c) we are told "how people think they would feel", not how they actually felt in the situation.
The mean squared error (MSE) achieved for the dataset is 0.03173. Humans' MSE is 0.02929.

Results
The following videos demonstrate the results obtained and showcase some of the properties of SNGNN.
Distance between two interacting people
In this video you can see how the distance between two interacting people affects the acceptance of the presence of a robot.
Impact of walls
In this video you can see how the distance between a wall and a person affects the acceptance of the presence of a robot. Surprisingly, the difference is not very noticeable but it is in line with existing studies.
Impact of incrementing the number of people in a room
This video showcases the ability of the network to adapt to an environment with a variable number of people. The response is as it would be expected: their spaces shrink as the density of people in the room increases. For example, people are way more relaxed about personal spaces in lifts than in open spaces.
Angle when approaching interacting people
We can appreciate in this video that the network is able to tell that, if a robot has to cross two people who are interacting, it should do it perpendicular to the line of interaction (i.e., the value of the function is minimum when the angle is perpendicular).
Stability of the results
This video shows a simulated environment where the robot is being MANUALLY MOVED WITH A JOYSTICK. Its purpose is to show the response of the network for the different positions and its stability.
References
Social-Navigation Graph Neural Network:
- Graph Neural Networks for Human-aware Social Navigation. L.J. Manso, R.R. Jorvekar, D.R. Faria, P. Bustos, P. Bachiller. arXiv preprint arXiv:1909.09003. 2019.
- SocNav1: A Dataset to Benchmark and Learn Social Navigation Conventions. L.J. Manso, P. Nunez, L.V. Calderita, D.R. Faria, P. Bachiller. arXiv preprint arXiv:1909.02993. 2019.
- Learning Human-Object Interactions by Graph Parsing Neural Networks.S. Qi, W. Wang, B. Jia, J. Shen, S.-C. Zhu. arXiv:1808.07962. 2018.
- Relational Graph Learning for Crowd Navigation. C. Chen, S. Hu, P. Nikdel, G. Mori, M. Savva. arXiv preprint arXiv:1909.13165. 2019.
Graph Neural Networks:
- Semi-Supervised Classification with Graph Convolutional Networks. T.N. Kipf, M. Welling. arXiv preprint arXiv:1609.02907. 2017.
- Relational inductive biases, deep learning, and graph networks. P.W. Battaglia, J.B. Hamrick, V. Bapst, A. Sanchez-Gonzalez, V. Zambaldi, M. Malinowski, A. Tacchetti, D. Raposo, A. Santoro, R. Faulkner, C. Gulcehre, F. Song, A. Ballard, J. Gilmer, G. Dahl, A. Vaswani, K. Allen, C. Nash, V. Langston, C. Dyer, N. Heess, D. Wierstra, P. Kohli, M. Botvinick, O. Vinyals, Y. Li, R. Pascanu-->. arXiv preprint arXiv:1806.01261. 2018.


